Are Black Holes Just a Phase?
A Momentous Measurement
Back in 2015, a massive collaboration of physicists, mathematicians, programmers, and more achieved the culmination of 40+ years of research and development. They were able to measure gravitational waves resulting from black hole mergers as part of the Laser Interferometer Gravitational-Wave Observatory (LIGO) Initiative. You can see their nobel prize winning results below.
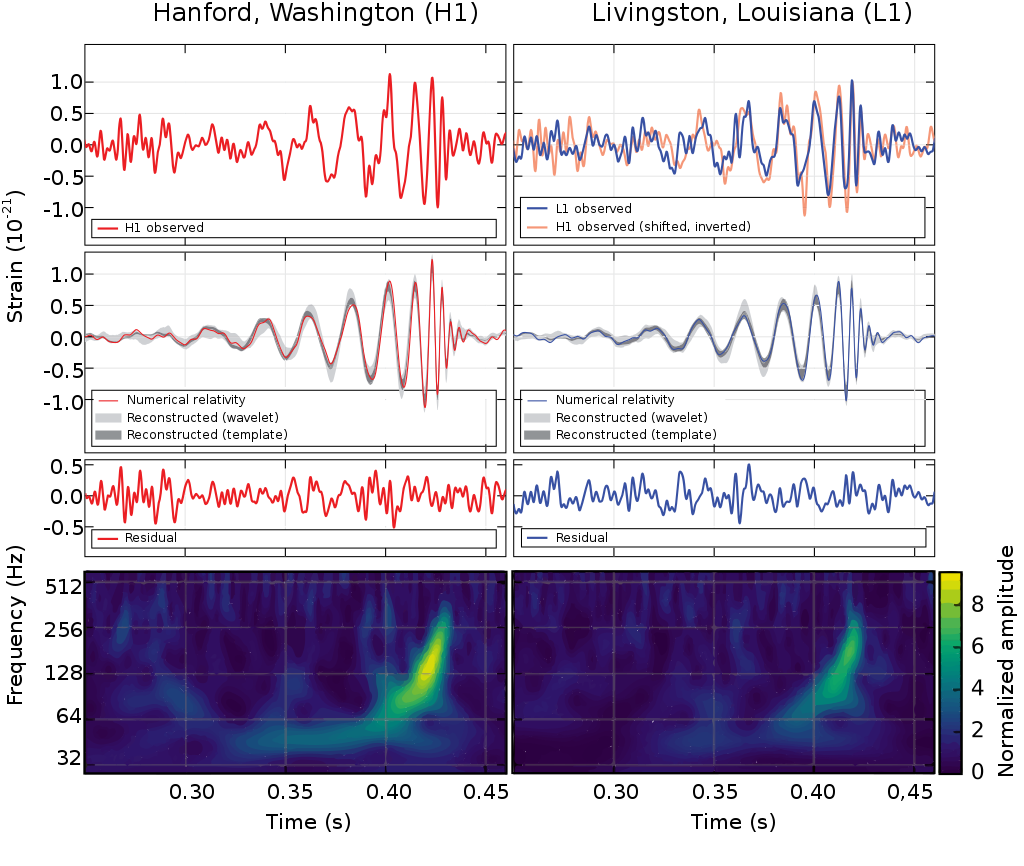
What you see above are various ways of seeing the signal via two LIGO interferometers, one in Hanford, Washington and the other located in Livingston, Louisiana. The 1st row is the raw measurement signal and the second third rows are theoretical predictions. Specifically you’re see plots of the amplitude in time for the first two rows and the spectral intensity vs time for the third row. The spectral intensity can be thought of as the intensity of the individual wavelengths or “colors” in the gravitational waves. These amplitude characteristics matched up There is of course another piece of these signals that is not shown here
A Signal in Two Tales: Phase and Amplitude.
When I was studying attosecond physics in graduate school I encountered an excellent text on Ultrafast laser pulse duration meausurement called “Frequency-Resolved Optical Gating: The Measurement of Ultrashort Laser Pulses” by Rick Trebino. In that book Dr. Trebino lays out how to reconstruct ultrafast laser pulses (femtoseconds in duration) and as part of it describes the two key ingredients to correctly do so: phase and amplitude.
For those unfamiliar with phase and amplitude, amplitude is the size of your signal. You can think of this as how “big” is the signal.
Visit the Hugo website!
Black Hole Data
I decided to use the gravitational wave (GW) supplied by Kaggle for this analysis. That data can be found here.